Prometheus has many samples rejected
Got this alert today from Prometheus and had no idea what it meant:
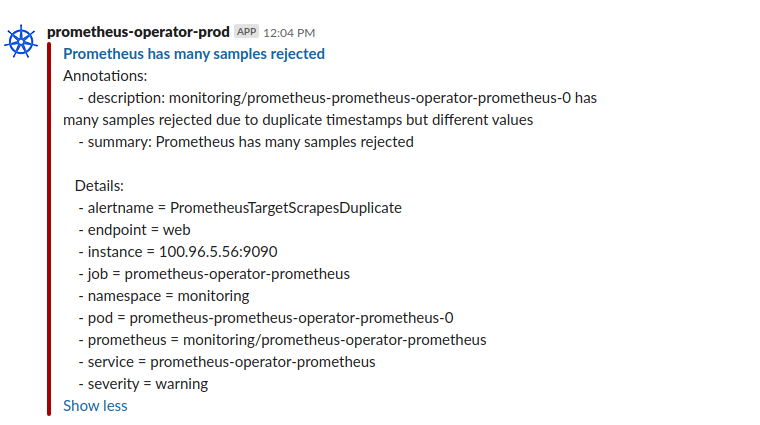
Looking at the Prometheus logs, it was full of similar lines like these:
level=warn ts=2019-08-20T20:24:00.084840306Z caller=scrape.go:1091 component="scrape manager" scrape_pool=managedkube/svcmon-managedkube-api/0 target=http://100.96.6.40:5001/ msg="Error on ingesting samples with different value but same timestamp" num_dropped=2
level=warn ts=2019-08-20T20:24:01.302097427Z caller=scrape.go:1091 component="scrape manager" scrape_pool=managedkube-demo/svcmon-managedkube-api/0 target=http://100.96.1.126:5001/ msg="Error on ingesting samples with different value but same timestamp" num_dropped=5
I did have a clue to go off of - someone told me they just deployed out the same service but to another namespace.
This is our normal regular service name: managedkube/svcmon-managedkube-api
This is the newly added service for a demo: managedkube-demo/svcmon-managedkube-api
That seems to make sense if two of the same services were being scraped and added in
without Prometheus changing the labels it would cause this. However, when Prometheus
scrapes the endpoints, it would usually add in the namespace label into the metric
which would make the metric unique.
I started to poke around in the Prometheus web interface to see if something
stands out. Going to the Service Discovery section:
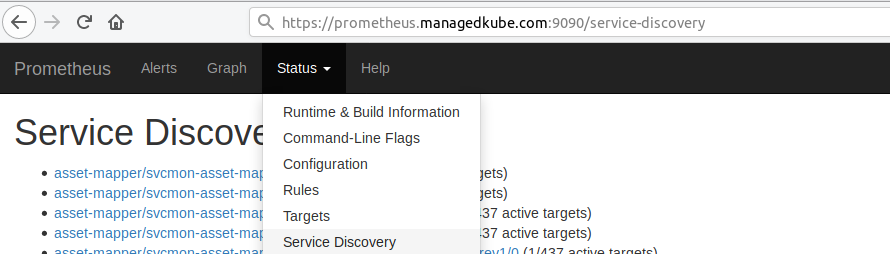
Looking at the service for the duplicate service of the new demo service: managedkube-demo/svcmon-managedkube-api
I noticed that the namespace which should have been managedkube-api-demo it was
still managedkube-api.
The problem here is that adding this additional Prometheus Service Monitor it was
scraping the old and the new service. Now there are two of the Service Monitors since
the deploy deploy this out as well. There were indeed duplicate metrics being put
into Prometheus.
The next thing to figure out is why?
Looking at the service monitor definition:
apiVersion: monitoring.coreos.com/v1
kind: ServiceMonitor
metadata:
  labels:
    app: svcmon-managedkube-api
    release: prometheus-operator
  name: svcmon-managedkube-api
  namespace: managedkube-api
spec:
  endpoints:
  - interval: 30s
    path: /
    port: prometheus
    scheme: http
  namespaceSelector:
    any: true
  selector:
    matchLabels:
      app: managedkube-api
The important part is:
namespaceSelector:
  any: true
This means that it will go through all of the namespace and pick up anything that matched the labels. This was causing the each service to be scraped twice.
The Service Monitor lives in the namespace of the service. The change and the fix
was to make it only select from the namespace that it lived in:
namespaceSelector:
  matchName:
  - managedkube-api
This fixed the problem and the alarm cleared up.
Need personalized help?
ManagedKube provides DevOps consulting services that help you leverage the power of Docker/Kubernetes in building highly resilient, secure, and scalable fully automated CI/CD workflows.
Schedule a free 15 minute consultation today by e-mailing us: consulting@managedkube.com
Contact me if you have any questions about this or want to chat, happy to start a dialog or help out: blogs@managedkube.com {::nomarkdown}
Learn more about integrating Kubernetes apps
{:/nomarkdown}
Learn more about integrating Kubernetes apps
kubernetes | prometheus