Kubernetes Troubleshooting Walkthrough - Tracing through an ingress
- Introduction: troubleshooting a Kubernetes ingress
- Diagnosing a Kubernetes ingress issue
- Tracing through with kubectl
- Need personalized help?
- More troubleshooting blog posts
Introduction: troubleshooting a Kubernetes ingress
I am writing a series of blog posts about troubleshooting Kubernetes. One of the reasons why Kubernetes is so complex is because troubleshooting what went wrong requires many levels of information gathering. It’s like trying to find the end of one string in a tangled ball of strings. In this post, I am going to walk you through troubleshooting a Kubernetes ingress.
When you are not able to reach your website or your API endpoint through a Kubernetes ingress, there can be various reasons on why that is the case. An ingress resource depends on a Kubernetes service and a service depends on pod(s) where it can send the traffic to. If any of these items are misconfigured or not in a ready state, you can potentially not reach your website or API endpoint.
For most people, they will be running the Kubernetes in a cloud (AWS, GCP, Azure, etc).
Kubernetes has cloud integration that are usually there by default. When you create a service
of type LoadBalancer, Kubernetes will create a loadbalancer in your cloud (FYI, load balancers
usually cost money and has an hourly billing rate associated to it like a machine).
If you are on AWS, it will create you an ELB (external ELB by default). You will
probably be using some kind of ingress controller such as the popular Kubernetes
Nginx Ingress.
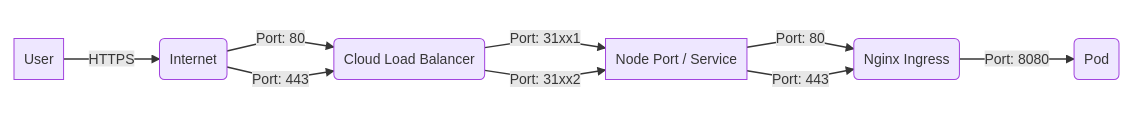
Kubernetes will then wire up the loadbalancer up for you, routing it to a NodePort that is dynamically assigned. This is the 31xxx in the diagram. From there, it will route the traffic to your pod specified
in your Kubernetes Service configuration. In this case, port 80 as the target port. Usually
all of this automatic wiring up is done correctly and it works on the first try. If
it doesn’t then you have to start troubleshooting where the problem is located.
Diagnosing a Kubernetes ingress issue
The main way you will notice this path is not working is when you encounter an error on your ingress where you can’t reach your website.
You should take note on what the error code the ingress loadbalancer returns
1xx (Informational): The request was received, continuing process
2xx (Successful): The request was successfully received, understood, and accepted
3xx (Redirection): Further action needs to be taken in order to complete the request
4xx (Client Error): The request contains bad syntax or cannot be fulfilled
5xx (Server Error): The server failed to fulfill an apparently valid request
You can get this code using the cURL cli:
$ curl example.com/foo -v
*   Trying 172.217.7.14...
* TCP_NODELAY set
* Connected to example.com (172.217.7.14) port 80 (#0)
> GET /foo HTTP/1.1
> Host: example.com
> User-Agent: curl/7.58.0
> Accept: */*
>
< HTTP/1.1 503 Service Unavailable
< Content-Type: text/html; charset=UTF-8
< Referrer-Policy: no-referrer
< Content-Length: 1564
< Date: Wed, 13 Feb 2019 19:28:34 GMT
< X-Cache: MISS from row44proxy-postauth
< Via: 1.1 row44proxy-postauth (squid/3.5.25)
< Connection: keep-alive
<
503
The error code the loadbalancer returned is a 503. Looking at wikipedia:
503 Service Unavailable
The server is currently unavailable (because it is overloaded or down for maintenance). Generally, this is a temporary state.[65]
This tells us a few things. It tells us that our we are making it to our ingress and
the Nginx ingress loadbalancer is trying to route it but it is saying there is nothing to route it to. When you receive this message, this usually means that no pods associated with this service is in a ready state. You should check if the pods are in a ready state to serve traffic.
Tracing through with kubectl
The following describes how you can trace an ingress flows through the system through each Kubernetes resources. List all of the ingresses:
$ kubectl get ing
NAME              HOSTS                         ADDRESS   PORTS   AGE
trace-ingress-4   trace-ingress-4.ingress.com             80      26d
Let’s get more details about the ingress we are working with: “web”.
$ kubectl describe ing trace-ingress-4
Name:             trace-ingress-4
Namespace:        dev-k8sbot-test-pods
Address:
Default backend:  default-http-backend:80 (10.44.72.16:8080)
Rules:
  Host                         Path  Backends
  ----                         ----  --------
  trace-ingress-4.ingress.com
                               /        trace-ingress-4:80 (<none>)
                               /admin   trace-ingress-4:9090 (<none>)

Events:                         <none>
The backend column for the ingress shows what service this ingress is associated
to and the port. We should at this point make sure this is correct and this is where
we want the traffic to go. If it is, the next step is to take a look at this service.
$ kubectl describe service trace-ingress-4
Name:              trace-ingress-4
Namespace:         dev-k8sbot-test-pods
Labels:            app=trace-ingress-4
Selector:          app=trace-ingress-4
Type:              ClusterIP
IP:                10.47.246.143
Port:              http  80/TCP
TargetPort:        8888/TCP
Endpoints:         10.44.73.12:8888
Port:              admin  9090/TCP
TargetPort:        9090/TCP
Endpoints:         10.44.73.12:9090
Session Affinity:  None
Events:            <none>
This output will give us information about how the service is configured. The
first and easy thing we want to check in the output is that there are Endpoints
in the list. These Endpoints are pod IPs.
If there are no endpoint, then the service has nothing to send the traffic to and that
is the problem. At this point you should look at the service Selector to make sure
that this is the correct service Selector. The service Selector selects is a set
of labels that are used to select which pods are in this service. This means that
the pods you want associated with this service should have the same labels as well.
You can do this by describing the pod:
$ kubectl describe pod trace-ingress-4-5db9d55849-msrjw
Name:               trace-ingress-4-5db9d55849-msrjw
Namespace:          dev-k8sbot-test-pods
Priority:           0
PriorityClassName:  <none>
Node:               gke-gar-3-pool-1-9781becc-bdb3/10.128.0.49
Start Time:         Wed, 27 Feb 2019 08:22:10 -0800
Labels:             app=trace-ingress-4
                    pod-template-hash=1865811405
...
...
If you checked that the labels are correct and there are still no endpoints, then
make sure there are pods that are running in a Ready state with these labels.
You can check by listing the pods and seeing if they exist: kubectl get pods
If you don’t see any pods here, then make sure however you deployed it out, that the pods show up.
If there are Endpoints associated with this service the next thing you should
check is if the ports are matching to what you expected. The incoming ports are
going to the correct target pod destination.
You will have to most likely describe the pod (kubectl describe pod <pod name>)
to get the detailed information about the pod and what port it is exposing.
$ kubectl describe pod trace-ingress-4-5db9d55849-msrjw
Name:               trace-ingress-4-5db9d55849-msrjw
...
...
Containers:
  trace-ingress-4:
    Image:          gcr.io/google_containers/echoserver:1.8
    Ports:          8080/TCP, 9090/TCP
    State:          Running
      Started:      Wed, 27 Feb 2019 08:22:25 -0800
    Ready:          True
    Restart Count:  0
    ...
    ...
...
...
To make sure it is going to the correct pod IP, you can use the get pods
command with the -o wide options. This will show you the IP column. This
IP should match up to what is in the service Endpoint list.
$ kubectl get pods -o wide
NAME                                                   READY   STATUS             RESTARTS   AGE   IP            NODE                             NOMINATED NODE
trace-ingress-4-5db9d55849-msrjw                       1/1     Running            0          9h    10.44.73.12   gke-gar-3-pool-1-9781becc-bdb3   <none>
Need personalized help?
ManagedKube provides DevOps consulting services that help you leverage the power of Docker/Kubernetes in building highly resilient, secure, and scalable fully automated CI/CD workflows.
Schedule a free 15 minute consultation today by e-mailing us: consulting@managedkube.com
More troubleshooting blog posts
- Kubernetes Troubleshooting Walkthrough - Pending pods
- Kubernetes Troubleshooting Walkthrough - Pod Failure CrashLoopBackOff
- Kubernetes Troubleshooting Walkthrough - imagepullbackoff
Contact me if you have any questions about this or want to chat, happy to start a dialog or help out: blogs@managedkube.com {::nomarkdown}
Learn more about integrating Kubernetes apps
{:/nomarkdown}
kubernetes | trace | ingress | service | port | not | matching | pod | port | k8sbot